
The 7 Best Trades Since the Iran War (Gold Wasn’t One of Them)
- Jet fuel in northwest Europe hit a record $220/bbl in March, roughly double pre-war levels.
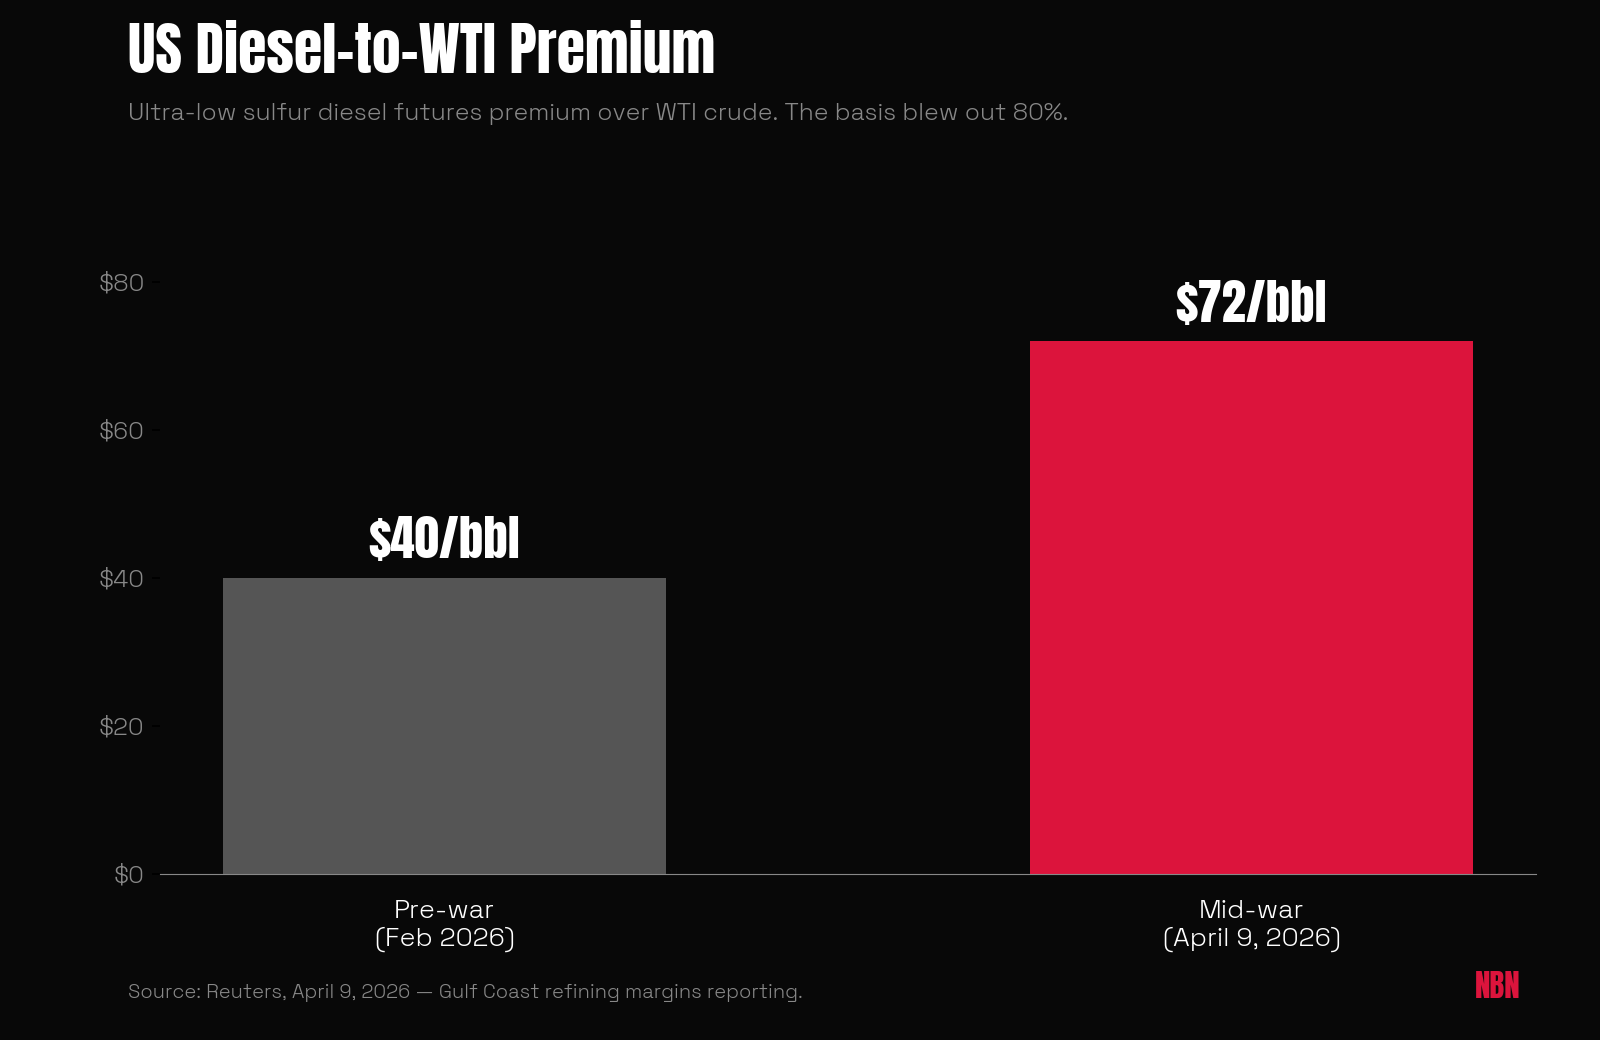
- The US diesel-to-WTI premium blew out from $40 to $72/bbl. Gulf Coast refiners captured most of it.
- Gold sat below pre-war levels. The VIX faded to its long-run average. The classic war hedges did not work.
Two months after the Iran war began on February 28, 2026, the biggest winners weren’t gold or Treasury bonds. They were jet fuel, diesel, and fertilizer. The war that closed the Strait of Hormuz created massive physical shortages in energy and agricultural inputs. Traditional safe havens sat the trade out.
So what actually paid? Cargoes, not correlations.
The ranking below is by move from the February 28 baseline, mixing futures, physical cargoes, basket prices, and one equity index. Treat percentages as directional. Two named perspectives sit on either side of the trade. The International Energy Agency’s Hormuz factsheet flags the counterweight markets have shrugged off: Iran’s own 2.41 million barrels a day also transit the strait, meaning Tehran bleeds revenue from any closure it imposes. Iran-aligned commentary argues the opposite, that Western markets are underestimating the duration of the disruption. Reuters’ emerging-markets strain reporting captures the consumer-side bear case: debt-stressed importers absorbing the input shock while Western majors capture margin.
For who pays the bill, see NBN’s eight sectors getting hit hardest by a Hormuz blockade and the Iowa farm pass-through.
1. Jet Fuel: The Undisputed Champion
- Performance: ~+100% from pre-war. NW Europe jet fuel hit a record ~$220/bbl in March.
- Tradeable proxies: Airline equities on the loss side (DAL, UAL, AAL, LUV, ICAGY); JETS ETF; heating oil futures (HO) as the closest exchange-traded proxy.
Jet fuel in northwest Europe hit a record around $220/barrel in March. That is roughly double pre-war.
Middle East refineries that normally supply global markets went offline. Alternative supply chains could not fill the gap fast enough.
Airlines did not have a choice. Pay up or ground flights. Ticket prices absorbed the spread.
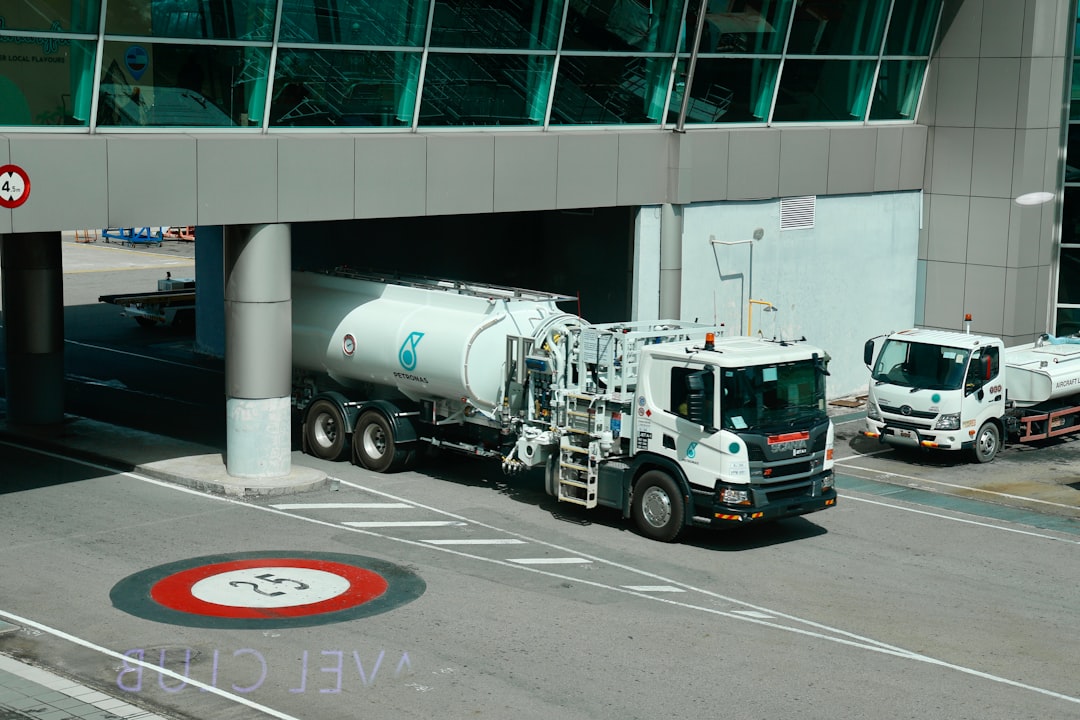
2. Diesel and Heating Oil: The Crack Spread Explosion
- Performance: US ULSD–WTI premium $40 → $72/bbl (+80% on the basis). European diesel breached $200/bbl, first time since 2022.
- Tradeable proxies: Heating oil futures (HO); Gulf Coast refiners (VLO, MPC, PSX, DINO); independent refiners (PBF, DK); refining ETF (CRAK).
European diesel breached $200/barrel for the first time since 2022. US ultra-low sulfur diesel futures traded at a premium of more than $72/barrel to WTI, versus about $40 before the war.
Trucking companies, farmers, and industrial users have no substitutes. They pay whatever refiners demand.
Walk the math. A Gulf Coast refiner running 500,000 bbl/day at the new $32/bbl margin expansion makes $16M/day more than before the war. Annualize: roughly $5.8B in incremental margin per refiner. Stack that across the largest operators and the answer to “where did the money go” gets short.
Gulf Coast refiners are printing.
3. Physical Crude Grades: When Futures Don’t Tell the Story
- Performance: Dated Brent ~+65% from pre-war. Dubai crude hit a record $166.80/bbl. Brent futures surged 64% in March.
- Tradeable proxies: Brent futures (BZ), WTI futures (CL); integrated majors (XOM, CVX, COP, SHEL, BP, TTE); E&P pure-plays (EOG, FANG, OXY, CTRA); ETFs (XLE, USO).
Dated Brent trades around 65% above pre-war. Middle East benchmark Dubai crude hit a record $166.80/barrel.

Physical crude moved harder than headline futures. Brent futures surged 64% in March, but physical barrels command even higher premiums.
When the Strait closed, futures repriced; the cargo market repriced harder.
4. Urea and Fertilizer: The Agricultural Shock
- Performance: Urea +30% to 40% in the first weeks ($470/ton base, +~$80/ton early). Sulfur and ammonia followed.
- Tradeable proxies: Nitrogen producers CF Industries (CF), Nutrien (NTR), Mosaic (MOS), Yara International (YAR.OL); diversified ag (DE, AGCO) on the loss side via lower acreage demand.
Urea prices rose 30% to 40% in the first weeks, with urea up around $80/ton from a $470/ton base early on. About a third of global fertilizer trade normally passes through Hormuz. The closure hit during planting season.

NBN’s separate Iowa pass-through breakdown tracks the consequence: a Farm Bureau survey found 70% of US farmers cannot afford all the fertilizer they need this season.
5. European Natural Gas: The LNG Disruption
- Performance: TTF spot spiked after strikes on Qatari and South Pars gas infrastructure. Magnitude varies by contract; Reuters confirms direct hits on supply.
- Tradeable proxies: US LNG exporters Cheniere (LNG), Tellurian (TELL); pipeline majors (KMI, WMB, ET); Henry Hub futures (NG); European utilities (RWE, IBE.MC, ENGI.PA) on the loss side.
European natural gas spiked after the war hit gas installations directly and knocked out LNG supply. Strikes affected Qatar’s Ras Laffan complex and damaged South Pars. There is no Plan B for stranded Qatari LNG cargoes on a short timeline.

Industrial users in Europe are curtailing production. LNG-dependent systems (Bangladesh, Pakistan, parts of India) get worse first.
6. Gasoline: The Consumer Fuel Squeeze
- Performance: US gasoline–WTI premium $18 → $26/bbl (+44% on the basis). Pump prices absorbed most of the spread.
- Tradeable proxies: RBOB gasoline futures (RB); Gulf Coast refiners (VLO, MPC, PSX); convenience-retail chains (CASY, MUSA) on the volume side.
US gasoline futures traded at a premium of nearly $26/barrel to crude, up from around $18 before the war. The $8/barrel increase translates directly to pump prices.

Refiners prioritize diesel and jet fuel because margins are higher. Gasoline gets what’s left.
7. The S&P 500: The Unlikely War Winner
- Performance: Hit a record intraday high on April 15, the first since the war began. Modest absolute gain (~+4%) but historically anomalous for a wartime two-month window.
- Tradeable proxies: Index ETFs (SPY, IVV, VOO); E-mini S&P futures (ES); leadership came from energy (XLE) with mega-cap tech/AI offsetting losses elsewhere.
The S&P 500 hit an intraday record high on April 15. Energy sector gains plus AI-driven mega-cap leadership offset losses elsewhere.

The rally splits market commentary. The bullish read, captured in Reuters’ late-April “see-through” analysis, is that markets are correctly pricing a contained, regional shock. Investors who bought into the war got paid.
The bearish read, in Reuters’ cross-asset correlations note and the emerging-markets strain piece, is that the rally is fragile. Permacrisis-pricing assumes the war stays contained. A second supply shock breaks the model.
You pick your side. The tape is up. The ground is not.
The Losers: Safe Haven Assets
- Performance: Gold sat below pre-war levels in some analysis windows. VIX faded to near long-run average. Bitcoin’s correlation to stocks rose, breaking its uncorrelated-asset pitch.
- Tradeable proxies: Gold ETFs (GLD, IAU); gold futures (GC); silver (SLV, SI); volatility (VXX, UVXY, VIX futures); bitcoin spot ETFs (IBIT, FBTC, BITB); long-duration Treasuries (TLT, ZB futures).
Traditional war hedges flopped. Gold remained below pre-war levels in some windows. The VIX normalized back toward long-run averages after an early spike. Bitcoin’s correlation to stocks rose sharply, erasing its diversifier pitch when investors needed it most.

Two reads. The market-efficiency case: the war’s impact concentrated in physical commodity flows, exactly where prices reacted. Gold and the VIX did not move because the broader US economy never came under threat. The fragile-hedge case: the same Reuters correlations graphic flags that historical cross-asset relationships have quietly broken down. Strategies built on gold rallying in war or bitcoin trading uncorrelated did not pay this time, and there is no guarantee they pay next time.
Either way, physical scarcity drove the moves this cycle. Financial fear gauges did not.
The Trade Behind the Trade
The cash followed the price moves into a narrow set of pockets. Western integrated majors and US Gulf Coast refiners took both the basis blowouts and the upstream price spike. Saudi Arabia and the UAE, with partial pipeline bypasses around Hormuz, kept clearing barrels. Fertilizer producers outside the Gulf captured the price spike on volume they could still ship.
Iran, Iraq, Kuwait, and Bahrain bled revenue from stranded barrels. End consumers (airlines, truckers, farmers, utilities) absorbed the input shock, mostly passing it through to ticket prices, retail diesel, food, and electricity.
Whether the equity calm holds is the open question. The bull case, captured in Reuters’ late-April market analysis, is permacrisis-pricing working as designed. The bear case is that the next supply shock looks nothing like this one.
The trade for the last two months was clear. The trade for the next two is not.


